Data analyser
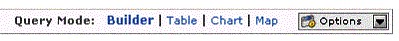
Use the CISID data analyser to create queries whose results can be displayed in tables or charts that can be exported in several downloadable formats. To build a query, click on the data analyser application on the system applications area. CISID then opens a new tab for you, labelled query 1. The application content area will then show you the builder mode of the data analyser. There are three query modes:
build query
display table
display chart.
Build query
The builder mode data analyser helps to create a query by splitting the process into three steps.
Build query
- Choose an indicator to research.
- Choose the country or countries to analyse by:
- clicking on their respective entries in the list of those available and then clicking “Add” to move them to the selected list, or
- selecting a group of countries from the drop-down list.
- Choose a time period by selecting the beginning and ending years from drop-down lists. The next step is to display the query results in a table or chart, by clicking on the display table or display chart button at the top of the data analyser.

Display query results
Display Table
When a user chooses the table mode, CISID queries the corresponding data set in the CISID data warehouse. The results are displayed in the application content page.
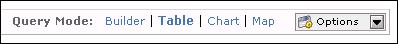
Display table
If the result is unsatisfactory, the user can return to the build query mode and refine the query.
To export a table, click on the options button on the top right-hand corner of the data analyser and select a format in which to download it. The user can reduce or increase the size of the table by using the zoom function, or create a printer-friendly version by clicking on the printer icon.
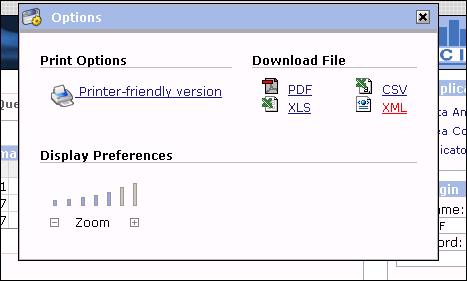
Export options
Chart
When a user chooses the chart mode, CISID queries the corresponding data set in the CISID data warehouse. The results are displayed in the application content page.
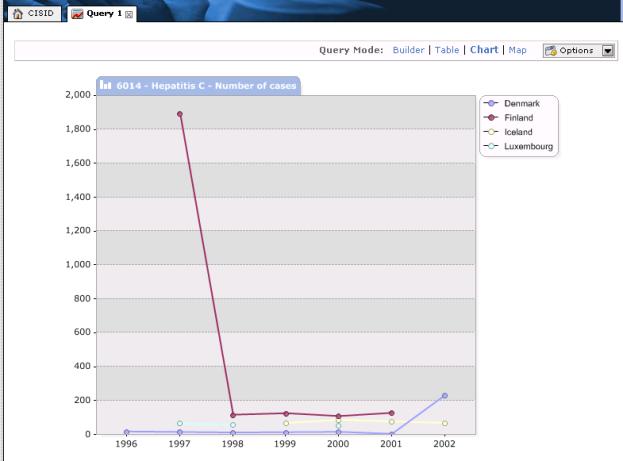
Display chart
If the result is unsatisfactory, the user can return to the build query mode and refine the query. To export a chart, click on the options button on the top right-hand corner of the data analyser and select a format in which to download it. The user can reduce or increase the size of the chart by using the zoom function, or create a printer-friendly version by clicking on the printer icon.

Export options
|